Working with the map snippet for part of the Goodnow Flow
I loaded Woody Olmsted’s Finch-Pruyn maps onto my ADK forestry Maps site but they are too big to be useful intact– unless you get them printed wall-sized, a letter-sized print out is too compressed.
For Goodnow Flow and surroundings I can pick out pieces to work with and compare detail to current maps. I’m guessing the water level was higher back in the 1930s. I was going to make a page on the topic for the forestry maps site but I’m not getting there so I switched to knocking out blog pieces for the GoodnowNewcomb site and maybe I’ll edit the bits together later. This is focused on the eastern end. The USGS map I used as a reference is a 1:25000 map dated 1997
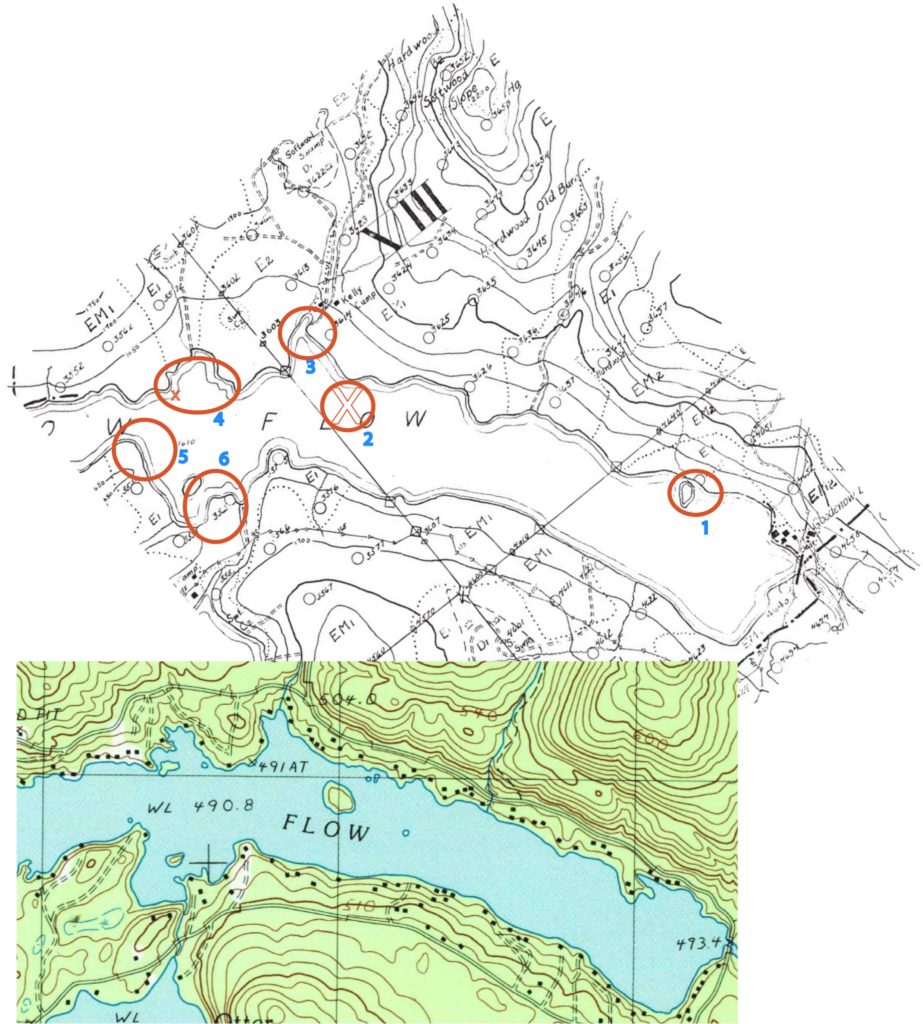

I attempted an overlay of the Forestry map over the USGS map – I couldn’t get features to line up consistently so it likely the Finch Pruyn map is not totally accurate. For starters, if you look over at the left/west side of an attempted overlay the Flow in the forestry map has to be too narrow, I used to run and compare 2D protein gels but I can’t make these fit tweaking the rotation and scale.
Water levels seemed to have changed, were higher
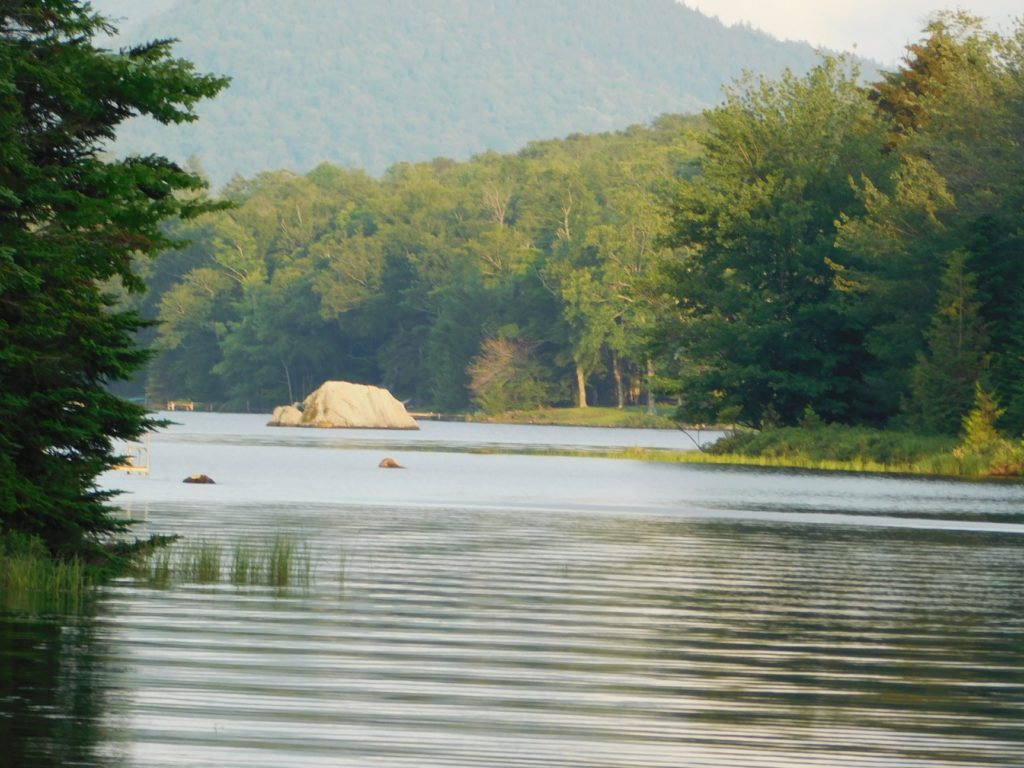
So the Finch Pruyn maps are not topographically up to the USGS level but most everyone at the Flow has passed by the islands. The one, offshore from lots 940-960 just isn’t there for the 1930s forestry map (#2 in the picture). The first thought was that they weren’t logging little islands so they just skipped it, but looking down towards the dam on the Northside I can see the logging map shows an island (#1) where there is now a peninsula (formerly was lots 135/6?) and that supports the idea that the water level was higher.
How much has the water level changed
So how much additional water depth would it take to drown that island. At a minimum a couple of feet (just looking out from my lot) and probably more.
One location where I can understand the terrain is my own lot – which is flagged as #3 and the island offshore from lots 940-960 is just down from the bay where I’m located. It looks to me like my cabin footprint was underwater.

The little bulge out into the bay that my cabin sits on at the water line is not there in the logging map (above). I figure that would take at least 4ft of water, maybe 6ft and then there would be an additional arc of lake with the much of the gorge that ‘my’ stream runs in being filled.
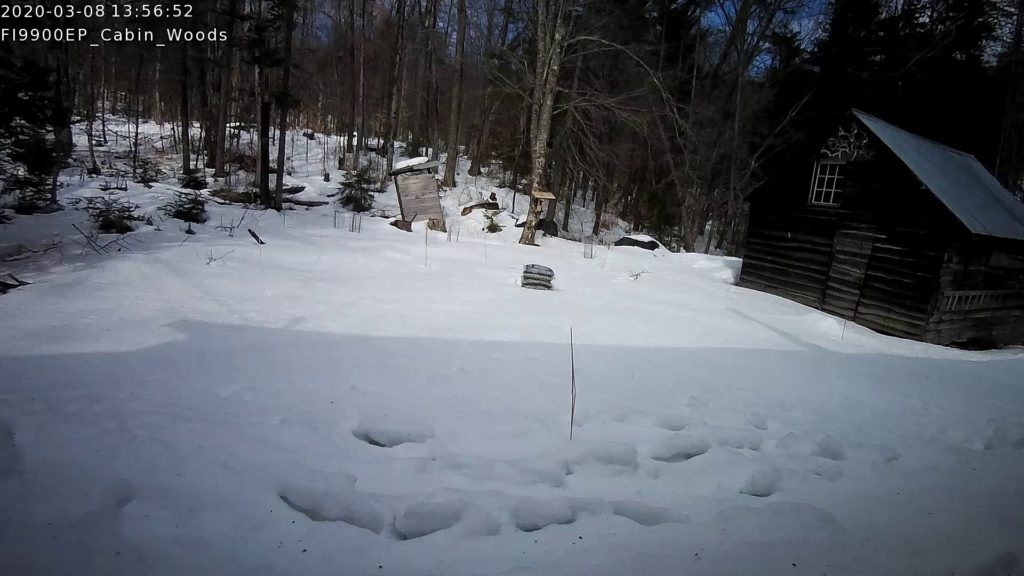
Once the water is over that bump it can reach across my backyard with the land angling up just beyond the tree line. The little gorge that ‘my’ stream runs in could easily fill with water until you reach the rock ledges and waterfall just before the current Woody’s Road (any roads were at best tracks or logging roads) and that kind of fits the map.
My dock drowns when there is local flooding and the flow levels pop. That is about a foot over summer levels. My cabin is perched on a slope and the piers are about a 16” out back but 32 inch on the water side (that’s a detail I recorded for planning a rebuild) and the front piers are maybe three feet above the level of the dock but I’ve never measured how far above the lake the cabin sits, maybe another couple or three feet? Combine those numbers and you need at least 4ft to start covering my cabin footprint and the back yard.
The shoreline on the south side of the flow near the outlet from otter pond also looks to have been significantly different. Generally, the slope up from the water is steeper on the south side so there was presumably less spread and change in the shoreline on ‘filling the bathtub’ more.
A different dam on the Goodnow river gave different water levels for the Goodnow flowage?

There is an old photo of an earlier version of the Flow dam, made into a postcard, in which which the barrier looks to be way higher than the current dam judging by the guys standing on it, the height of the gushing leaks in the gates and assuming the location hasn’t moved much. I’ve heard the suggestion that the lake level was varied to flush the harvested timber downstream onwards to the Hudson with Finch Pruyn mill in Glens Falls as the destination.
1 Comment